14166 Views
Mobility
Questions hover over plug-in hybrids
Many choose a plug-in hybrid vehicle to obtain the 0 label and circulate freely
Sometimes we are faced with concepts that are difficult for us to assimilate and understand. In 2020, each citizen of the European Union emitted, on average, around 5.34 metric tons of CO2, according to the European Energy Agency. This figure pales in comparison to the 12.98 metric tons emitted by American citizens, but it is well above the 1.69 metric tons of the inhabitants of India, and above all, it considerably exceeds the world average (4.39 metric tons). It seems obvious that, nowadays, the less CO2 we emit, the better. But how much is a lot? What does a metric ton actually mean?

In the 1970s, scientists around the world warned that certain chemicals (especially aerosols) used by people in their daily lives were causing damage to the ozone layer. The future was full of skin cancers, cataracts, and the extinction of many plant species. Thanks to the Vienna Convention for the Protection of the Ozone Layer, human beings were able to reverse the damage. It is estimated that the ozone layer will be completely restored around 2060 and that several areas of the planet will return to pre-1980 levels in the coming years.
The solution to the hole in the ozone layer was quickly proposed and adopted, and it worked. And this was because a hole in the ozone layer is something easy to imagine. It was clear to everyone that a hole in the planet’s protective layers could not be a good thing. The definition of the problem became one of the keys to the application of the solution. In the case of climate change, a graphic and clear representation of the problem is much more elusive. And therein lies some of our inability to counter it.
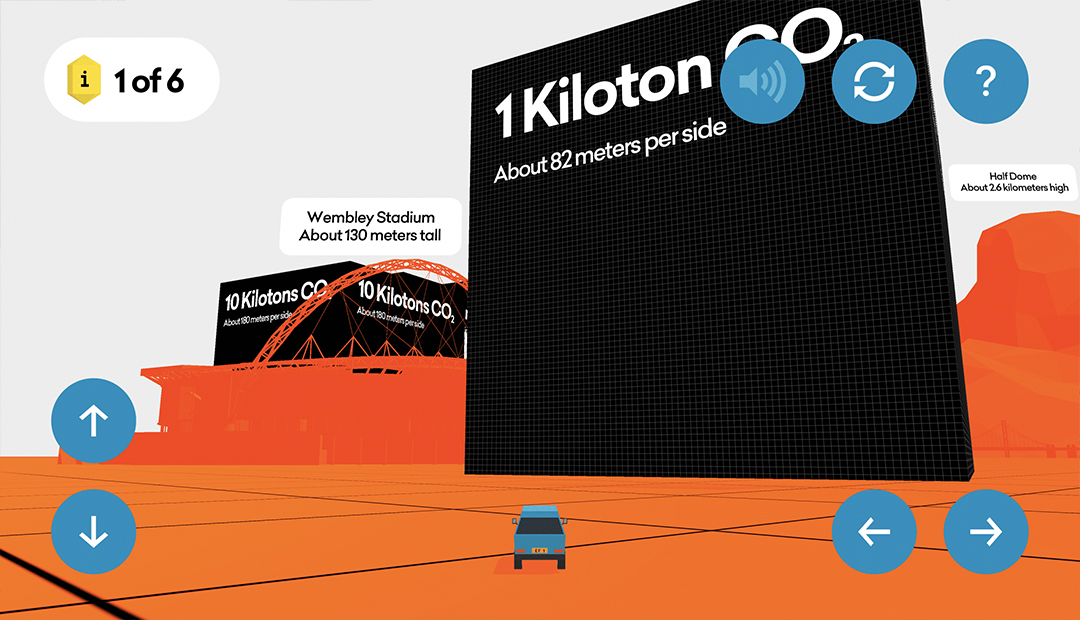
For the London-based Extraordinary Facility design studio, design and its applications are the perfect tools to increase our understanding of greenhouse emissions. Few people are capable of imagining metric tons, kilotons, and megatons. It is simply impossible for those who are not used to dealing with such concepts. Therefore, the information on CO2 is elusive for most people. Extraordinary Facility, through its game Seeing CO2, has set out to make greenhouse gas measurements much easier to grasp.
The dynamics of Seeing CO2 are simple. While driving a car with the keyboard, we can see the volume that different gas measurements would have in real life. By placing them next to monuments such as the Eiffel Tower or geographical features such as Mount Everest, we can get an idea (although imagining the size of Mount Everest is still somewhat difficult) of how outrageous human CO2 emissions are.
As the founder of Extraordinary Facility said to the publication on creativity It’s nice that, “Although Seeing CO2 looks like a game, it is “more like an article or a public service announcement that happens to take the form of a video game.” Presenting this type of information to people is important so that they get an idea of what we are facing when we talk about climate change.
By comparing the volumes of CO2 emissions with monuments and geographical features we are able to benefit from an accurate representation of the impact that our activity has on the planet. Knowing that Everest is smaller (in volume) than one gigaton is useful to be able to fully comprehend the sheer size of the 35 gigatons of CO2 emitted by humans in 2019. Similarly, it allows us to make more sense of the more than 15 gigatons produced by coal burning.
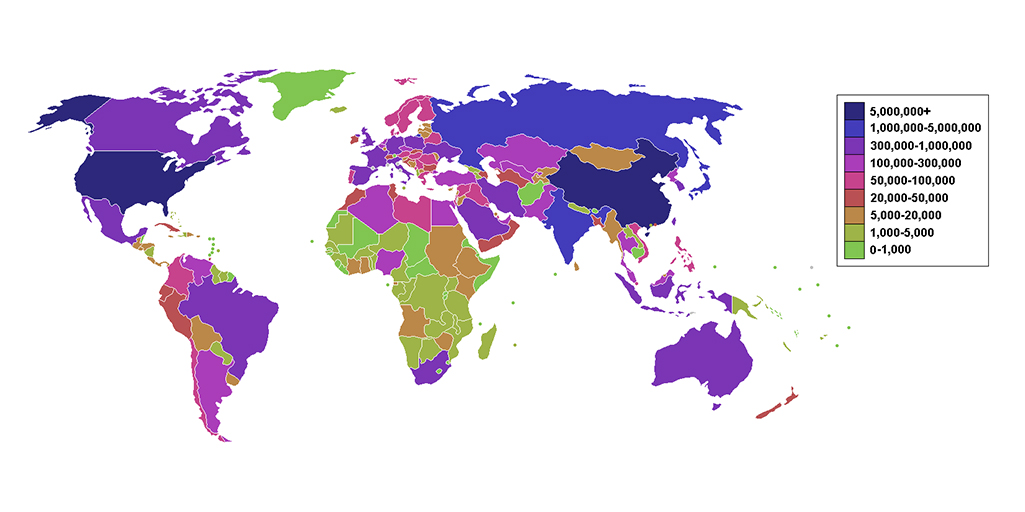
In addition, through Seeing CO2, curious players can get an idea not only of the volume of carbon dioxide emissions from humans over a year, but also of how each country fares in this area, along with seeing the volumetric representation of the CO2 emissions per capita of many different countries. In this way, they will know which countries are at the forefront in emissions per inhabitant (and they might be surprised at which countries these are) and, above all, fully understand the reality of the need to reduce carbon dioxide emissions. Because, ultimately, it is not the same thing to ask a country that emits 13 metric tons per capita (the US) to make a 50% reduction as it is for one that emits only 1.7 (India).
What is a metric ton of CO2 ? To answer that question you will have to go to the Extraordinary Facility website and have a (good) time driving the blue Seeing CO2 car.